Federated machine learning with a dual graph approach, embedded in a self-sustaining ecosystem, is revolutionising rare disease research: Patient data remains securely on hospital servers and never leaves them - maximising privacy. At the same time, the technology enables everyone from experienced software architects to the passionate mother of an affected child to develop algorithms and contribute to improved diagnostics. This model encourages innovation and collaboration without compromising sensitive healthcare data - a critical step towards faster and more accurate care.
Get Started
We would be delighted if we could arouse your interest! If you or your company would like to get directly involved, please contact Henrik Otterstedt from Dr von Hauner Childrens Hospital: Henrik.Otterstedt@med.uni-muenchen.de.
1 - About the data
2000 patients and 500 healthy controls.
All patients have a manually curated ICD10 diagnosis code.
Data Modalities:
The clinical lab data:
between 0 to 30 terms and parameters per subject with abnormal findings being translated into HPO-Terms and introduced into knowledge graph.
Blood Test Measurements
Urine Test Measurement.
Unstructured data
Medical History Questionnaire (about 900 questions)
Doctor’s Letters
Genomics data
Top 10-20 prominent genes selected from about 6000 mutations per subject. Genetic variations that showed a CADD-score of 6 or higher were selected and only the variant with highest value per gene was chosen.
Proteomics data
Between 1000-2000 proteins with quantitative values for each subject.
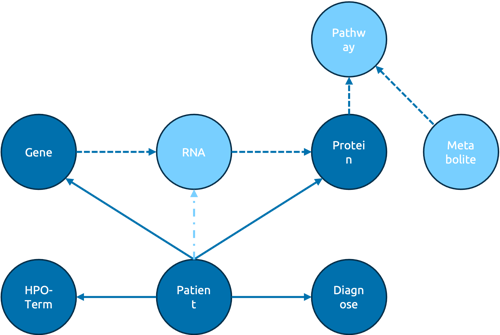
2 - Graph Data Model
Graph data model is a widely used framework to describe and analyze relationships between entities in a dataset. In a graph data model, data is organized into nodes representing objects or entities in a dataset, and edges representing the relationships between the nodes. A node can have attributes or properties describing its characteristics and an edge can be directed, undirected or bidirected to give a more accurate description of the relationship.
Graph data models are particularly well-suited for modeling complex networks, such as social networks, biological networks, transportation networks, and knowledge graphs. They enable efficient querying, traversal, and analysis of interconnected data, allowing for the discovery of patterns, insights, and dependencies within the dataset.
Knowledge Graph
A Knowledge Graph is a representation of a knowledge domain using the graph data model, readable by both humans and machines.
Knowledge graphs are used to model complex information in a way that can be easily understandable. They can use ontologies (e.g., human phenotype ontology) to define the vocabulary and structures of classes, properties and relationships in a domain knowledge to ensure consistency and allow compatibility between different graphs.
To learn more about graph data modeling and gain some hands-on experience, you can take the free graph data modeling fundamentals course at Neo4j Graph Academy.
3 - AMIGO
Advanced Medical Intelligence for Guiding Omics-based Medicine
IHI Call 9
Contact
Prof. Dr.Christoph Klein Dr.von Hauner Children’s Hospital Munich, Germany christoph.klein@med.uni-muenchen.de
To empower a journey of investigation leading to precision medicine for children and adults with rare and common immunological diseases
Contribution through collaboration
Real time access allows development in-time
Early involvement and access secures targeted project progress
New marketing strategies will be established
Approach to solve the problem
Innovative ecosystem
Ensure evolution from pediatric immunological diseases to general adult care -paving the way to personalized medicine
Outcomes and Impacts
Access to precious multi-omics data (of > 10.000 European patients)
Technological Independence
Joint forces of leading European Children’s Hospitals
Innovative ecosystem will empower target identification and validation via multi-omics analysis in immunological disorders.
European Union’s health industry will be strengthened to become competitive on a global level by collecting and using European patient data.
Patients will benefit by collaboration, gradual roll-out, and design of novel diagnostic methods and therapeutic strategies establishing personalized medicine.
Fill in the details of your app and choose an image name. Note: that no frontend is needed for our purposes and the URL link may direct to our GitHub repository.
Create and implement an application based on a template: featurecloud app new --template-name=app-blank app-blank
Build your application: featurecloud app build ./app-blank my-app`
Test your application with Testbed: featurecloud test start --controller-host=http://localhost:8000 --app-image=my-app --query-interval=1 --client-dirs=.,.
Note 1: you may have register first with docker login featurecloud.ai.
Find an App
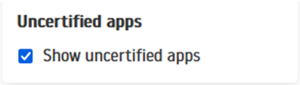
To see your app in the store you must tick the respective option:
Run an App
To run an app you created, click on the Projects tab.
Click on Create and name you project.
Click on the blue button with arrow next to your app. Make you pushed an updated image of your app.
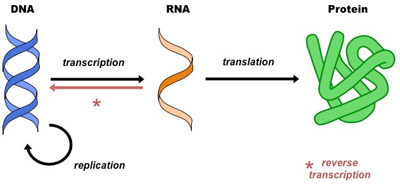
In 1958, Francis Crick proposed the Central Dogma of molecular biology. This principle outlines the flow of genetic information though a biological system. Information stored as DNA, is transcribed into RNA which is then translated into proteins.
DNA Replication
Before cells divide, they must replicate their DNA to ensure that each new cell receives a complete set of genetic information. DNA replication is a highly accurate process that involves unwinding the DNA molecule and synthesizing new strands complementary to the original strands.
Transcription
Transcription is the process by which the genetic information encoded in DNA is copied into a complementary RNA molecule. This process takes place in the cell nucleus and is carried out by an enzyme called RNA polymerase. The resulting RNA molecule, known as messenger RNA (mRNA), serves as a template for protein synthesis.
Translation
Translation is the process by which the genetic information carried by mRNA is decoded to produce a specific sequence of amino acids, which are the building blocks of proteins. This process takes place in the ribosomes, cellular structures composed of RNA and protein. Transfer RNA (tRNA) molecules bind to specific amino acids and deliver them to the ribosome, where they are joined together to form a polypeptide chain, or protein.
Gene
Gene is a segment of DNA that contains the instructions for building and functioning of an organism. Genes are the basic units of heredity, passed down from parents to offspring, and they play a crucial role in determining an organism’s traits and characteristics.
Genes typically consist of two main sections: coding regions and non-coding regions.
Coding regions, also known as exons, contain the instructions for building proteins. These regions are transcribed into messenger RNA (mRNA) which serves as a template for protein synthesis, with each set of three nucleotides (codon) coding for a specific amino acid, the building block for proteins.
Non-coding regions include introns, which are intervening sequences within genes that are spliced out during mRNA processing, and regulatory regions, which play crucial roles in controlling gene expression. Regulatory regions contain sequences that serve as binding sites for transcription factors, proteins that regulate the initiation of transcription. By binding to specific DNA sequences, transcription factors can modulate the expression of nearby genes, influencing their activity levels.
Gene Expression
Gene expression refers to the process by which the information stored in a gene is used to create a functional product, such as a protein. This process involves transcription of DNA into RNA and translation of RNA into protein. Gene expression includes a series of tightly regulated steps that control when, where, and how much of a particular gene’s product (usually a protein) is produced. This regulation is crucial for maintaining the proper functioning of cells and tissues in an organism. Factors such as environmental cues, developmental stage, and cell type can influence gene expression patterns.
Disruptions in gene expression can lead to abnormal levels or functions of proteins, which can contribute to disease development. For example, mutations in regulatory regions of genes can alter the timing or amount of gene expression, leading to overproduction or underproduction of a particular protein. Similarly, mutations within the coding regions of genes can result in defective proteins or proteins with altered functions, which can disrupt normal cellular processes and contribute to disease phenotypes.
A mutation in the coding part of a gene can lead to various consequences, ranging from premature truncation of the protein production to frameshifting the coding sequence and resulting in a nonfunctional or severely altered protein.
5.2 - Omics Data and Personalized Medicine
Omics data refers to large-scale data generated from high-throughput techniques that study various biological components on a comprehensive scale.
The term “omics” is derived from disciplines such as genomics, transcriptomics, proteomics, metabolomics, and others, each focusing on different types of biological molecules.
Genomics: Genomics involves the study of an organism’s entire genome, including its genes and their functions, as well as interactions between genes and other elements within the genome.
Transcriptomics: Transcriptomics focuses on the study of all RNA molecules present in a cell or tissue at a given time, providing insights into gene expression patterns and regulation.
Proteomics: Proteomics involves the study of all proteins present in a cell, tissue, or organism, including their structures, functions, and interactions.
Metabolomics: Metabolomics aims to identify and quantify all small-molecule metabolites present in a biological sample, providing insights into cellular processes and metabolic pathways.
Integrating multiple omics datasets, allows for a holistic characterization of individual patients and their unique molecular profiles. By integrating omics data with clinical data, electronic health records, and other relevant information, healthcare providers can develop personalized treatment plans tailored to each patient’s specific needs, preferences, and genetic makeup.
Currently, our study incorporates genomics and proteomics data and in the near future, transcriptomics and metabolomics will also be covered.
5.3 - Human Phenotype Ontology
The Human Phenotype Ontology (HPO) is a standardized vocabulary and framework for describing phenotypic abnormalities observed in human diseases in terms of clinical features (symptoms) and other observable characteristics, associated with genetic disorders and other medical conditions.
The HPO can be used to support differential diagnostics, translational research, and applications in computational biology by providing the means to compute over the clinical phenotype. The HPO is being used for computational deep phenotyping and precision medicine as well as integration of clinical data into translational research.
HPO terms are organized hierarchically, with more specific terms nested under broader categories. Each term is assigned a unique identifier and includes synonyms, definitions, and relationships to other terms within the ontology.
Example of an HPO term
HPO Term: Microcephaly (HP:0000252)
Definition: A condition characterized by a smaller than normal head circumference.
Hierarchy: Microcephaly is a subtype of “abnormality of head or neck” and is more specific than the broader term “abnormality of head size.“
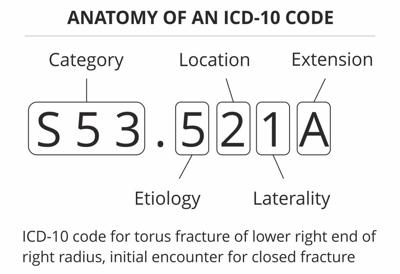
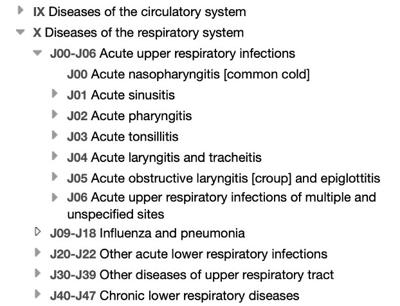
The International Classification of Diseases (ICD) is a standardized system used worldwide for classifying diseases, health conditions, and related factors. ICD-10, which is the latest revision, provides a comprehensive framework for organizing and categorizing diseases and health conditions based on their etiology, anatomical location, severity, and other relevant factors.
ICD-10 codes are alphanumeric codes that represent specific diseases, conditions, and medical procedures. These codes are used in healthcare settings for billing, recording, reporting, analyzing and clinical decision-making.
The Combined Annotation Dependent Depletion (CADD) score is a numerical measure used in genetics to predict the deleteriousness, or harmfulness, of genetic variants.
Using machine learning models, CADD combines genomic features derived from surrounding sequence context, gene model annotations, evolutionary constraint, epigenetic measurements and functional predictions to estimate the likelihood that a given genetic variant will have a harmful effect on protein function or lead to a disease phenotype.
Imagine you’re a scientist studying genetic mutations in a particular gene associated with a rare disease. You’ve identified a mutation located in a critical region of the gene that codes for an essential protein. Now you want to assess its potential impact on protein function and disease risk.
After running the variant through the CADD tool, you obtain a CADD score of 25. This score indicates that the variant is predicted to be among the top 25% most deleterious variants in the human genome, suggesting a high likelihood of it causing a harmful effect or contributing to disease.
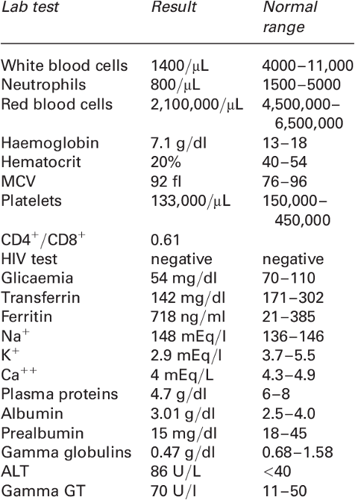
The clinical laboratory data includes results from the blood and urine tests.
Blood Test
The most routine blood test is the complete blood count, and it measures the levels of various components of every major cell in the blood, including red blood cells (RBCs), white blood cells (WBCs), platelets, hemoglobin, and hematocrit. It provides valuable information about the overall health and functioning of the blood and can help detect a wide range of conditions, such as anemia, infections, inflammation, and bleeding disorders.
Another very common test is the basic metabolic panel, which is a group of tests that measure different naturally occurring chemicals in the blood. This is carried out on the plasma part of the blood, and it measures the levels of glucose, electrolytes (such as sodium, potassium, and calcium) and kidney function markers (such as creatinine and blood urea nitrogen). These components provide insights into organ function, metabolic status, and risk factors for certain diseases.
The lipoprotein panel also known as the lipid profile, measures the levels of LDL and HDL cholesterol and triglycerides, indicating the risk of cardiovascular diseases and other conditions.
A routine urine test, also known as a urinalysis, examines the physical, chemical, and microscopic properties of urine. It includes visual, chemical and microscopic examinations.
The appearance of the urine, its clarity and color can indicate the presence of blood, proteins and certain drugs.
The chemical test includes placing a stick with chemical strips in the urine. The strips would change color indicating the presence or levels of different components such as glucose, ketones, proteins, bilirubin, blood, nitrites, leukocytes, and erythrocytes as well as the pH and concentration of the urine.
The microscopic examination involves viewing drops of concentrated urine under a microscope to detect the presence of crystals, casts (tube-shaped proteins), pathogens, red blood cells, white blood cells and epithelial cells. These can provide additional diagnostic information.